Devtools Dashboard
ligero-devtools is a visual debugger for development served at
/ligero/dev — a graph-centred workbench where you run a request, watch it
flow through your beans, and inspect the JSON going in and out of every layer,
with timings, all without a debugger, a log line, or an external tool like
Postman.
Think of it as Swagger's "try it out" + a live dependency graph + a per-request tracer, in one page, shipped inside your jar (self-contained HTML, no CDN), and switched off with a single flag for production.
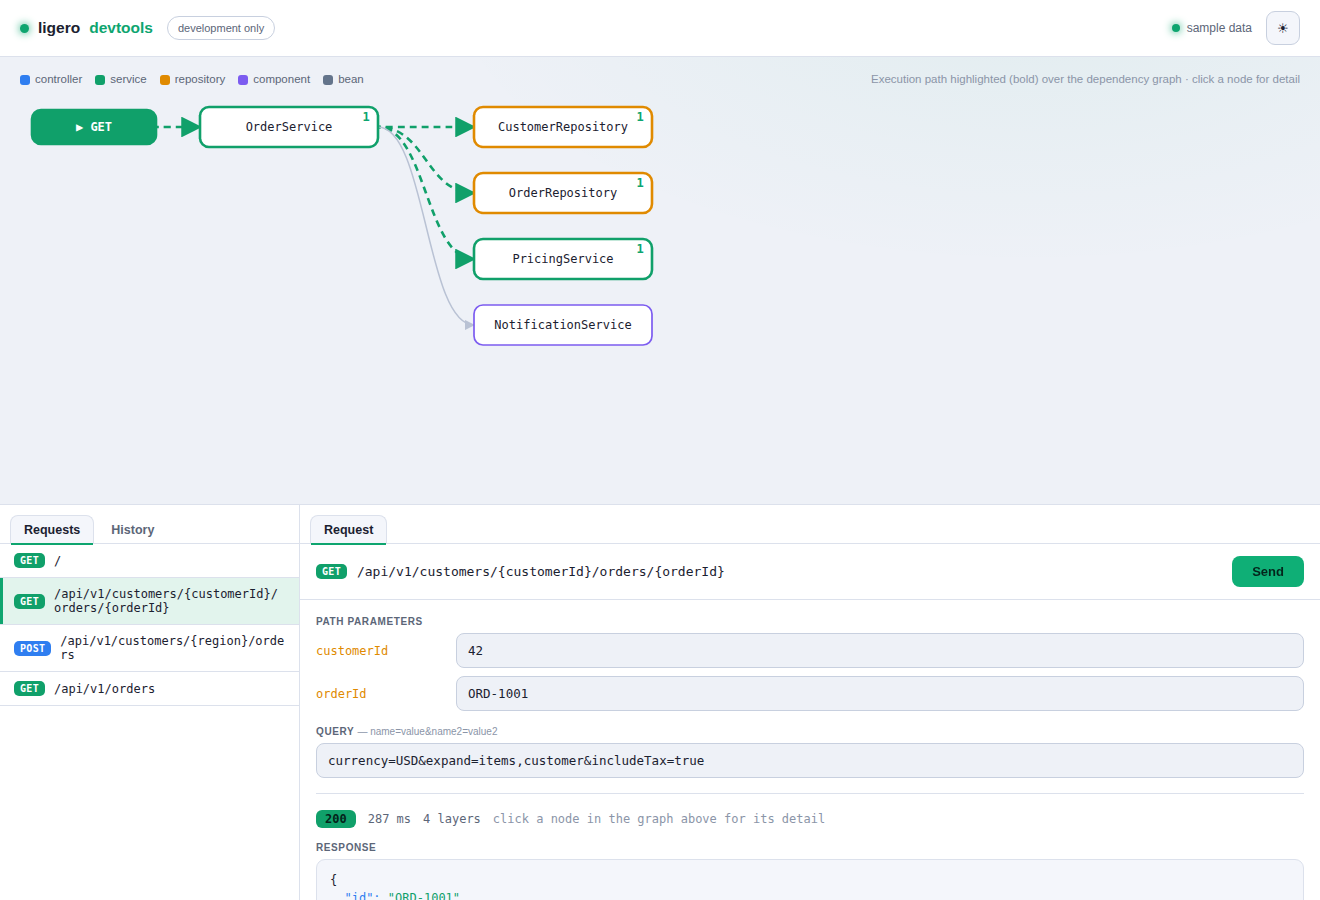
Why it exists
| Without devtools | With devtools |
|---|---|
| Fire requests from curl/Postman in another window | Run any route straight from the dashboard |
| Read logs to guess which beans ran | See the exact path light up in the graph |
Add System.out.println to see a layer's args/result | Click a node — arguments and return value are shown as JSON |
| Wonder how long each layer took | Every call carries its timing; the path shows the critical route |
| Keep a mental model of your wiring | The dependency graph is drawn for you, coloured by stereotype |
It's built on the same Beans container and
layered architecture Ligero already encourages — devtools
just makes them visible.
Setup
Add the dependency (development only) and instrument your beans:
// build.gradle — never ship this to production
implementation 'com.ligeroframework:ligero-devtools:0.6.0'
Devtools devtools = Devtools.create();

Beans beans = Beans.builder()
    .bind(NameRepo.class,     b -> new JdbcNameRepo(b.get(DataSource.class)))
    .bind(GreetService.class, b -> new DefaultGreetService(b.get(NameRepo.class)))
    .instrument(devtools.recorder())   // spies interface-typed beans
    .start();

Ligero app = Ligero.create();
app.beans(beans);
devtools.install(app, beans);          // mounts /ligero/dev — call before app.start()
app.start(8080);
Prefer to scaffold it? The CLI wires devtools into
new projects by default — opt out with --devtools false:
ligero new my-api                     # devtools ready at /ligero/dev
ligero new my-api --devtools false    # lean app, no devtools
Open http://localhost:8080/ligero/dev.
The workbench
The page has two zones: the bean graph on top and a request workbench below (a request list on the left, an editor / detail panel on the right).
1. Pick and run a request
The left Requests tab lists your app's routes. Select one and the editor
fills in its path parameters, query and JSON body; press Send and Ligero
fires the call for you (correlated with an X-Ligero-Dev header so the trace it
produces is matched back to this exact request). The response — status, timing,
JSON body — appears right there.
2. Selecting shows the dependency graph; running shows the path
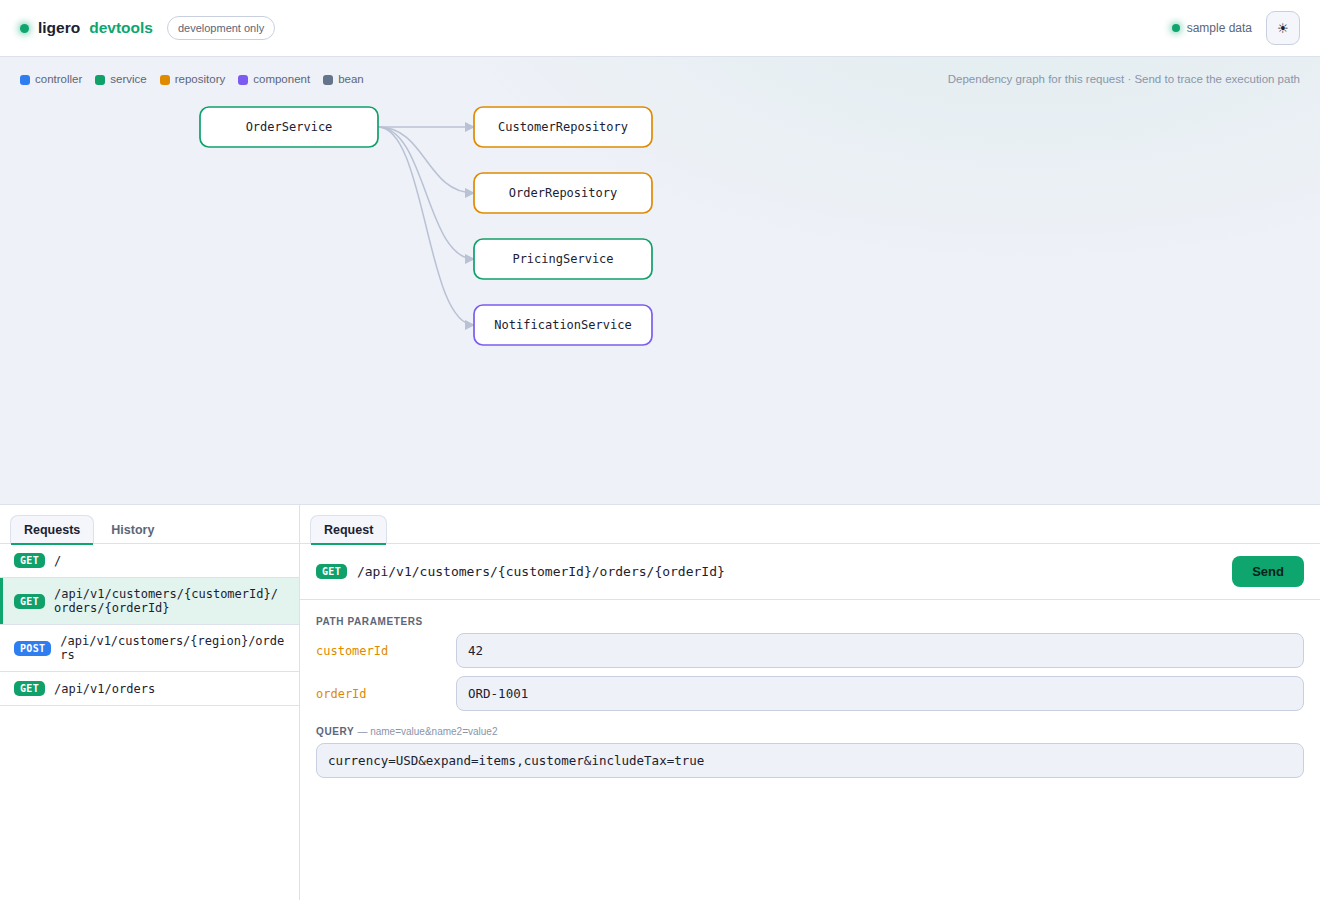
Selecting a request lights up its dependency graph — every bean it can reach (controller → services → repositories) — and dims the rest. No execution path is drawn yet, because which branch runs isn't known until you send it (a service may call one repository or another depending on a validation).
Press Send and the actual execution path is overlaid in bold, animated, in the HTTP method's colour. A dependency that this run didn't take stays visible but is clearly not part of the execution.
3. The path is coloured by method
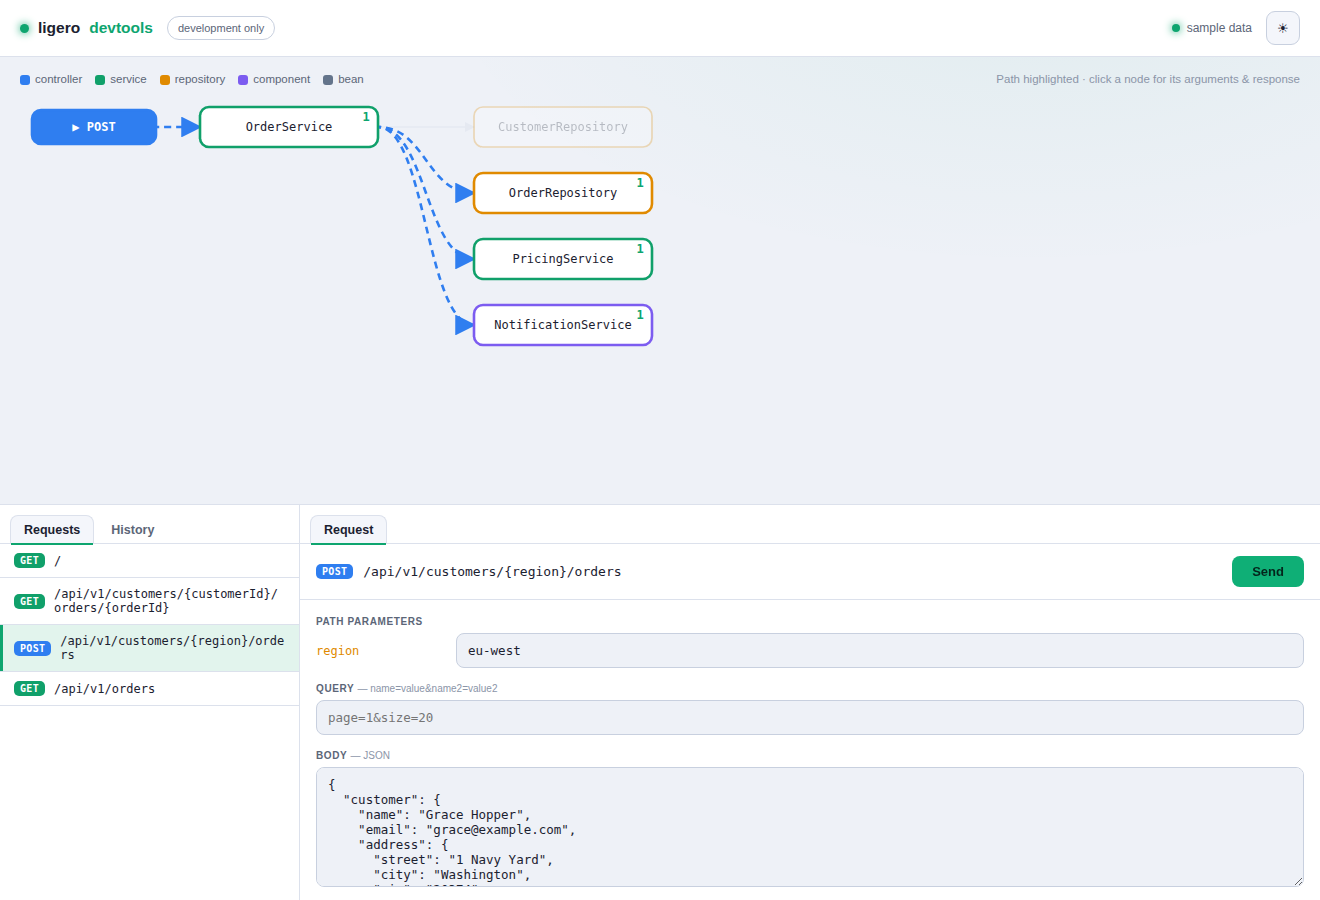
The highlighted path takes the request's method colour — GET green, POST blue, PUT amber, DELETE red, PATCH purple — matching the verb badges, so a glance tells you what kind of call you're looking at.
4. Click a node for its per-layer detail
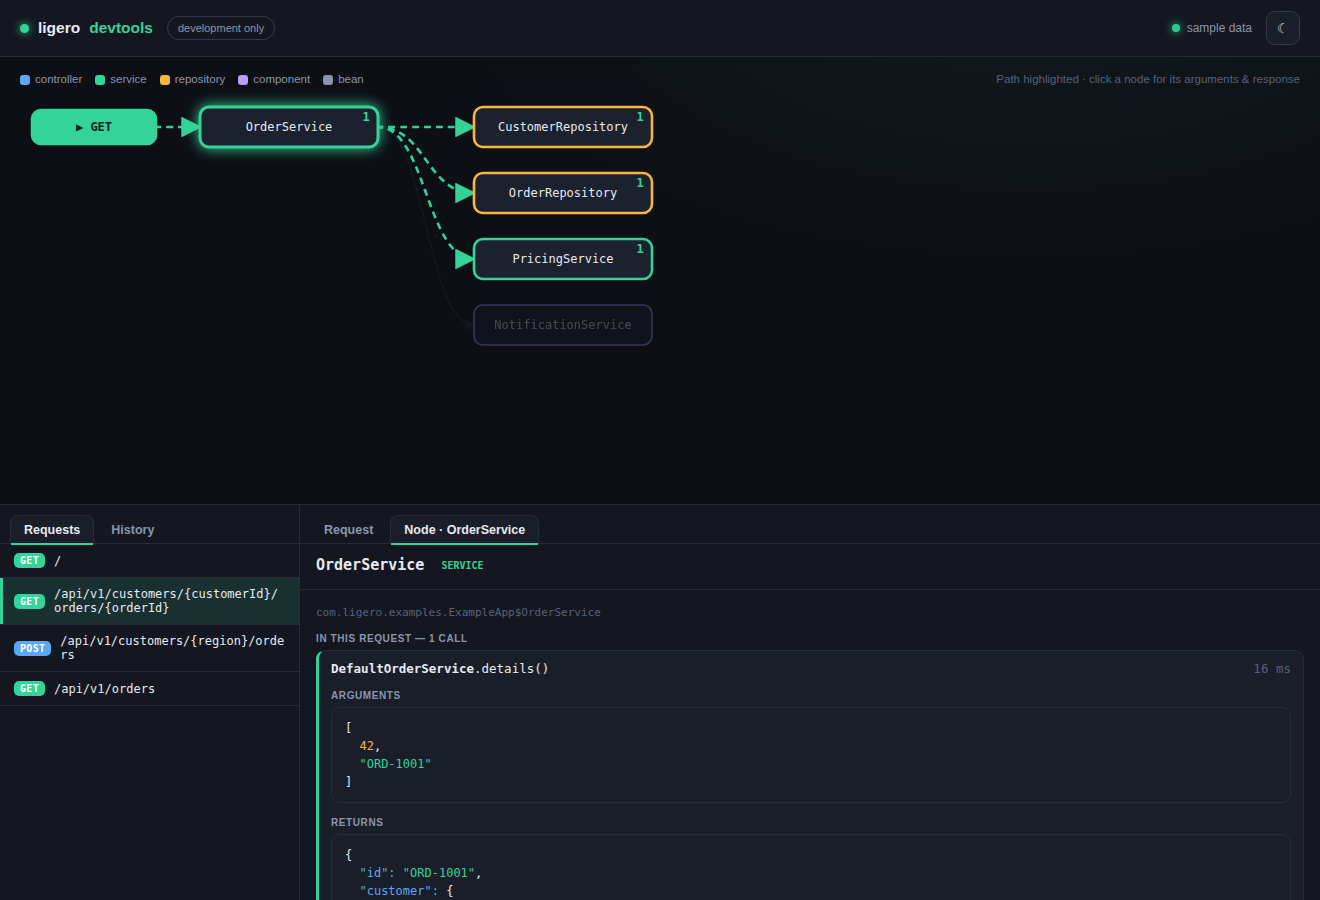
Click any bean and the right panel shows, for the selected run, each of its
invocations with arguments and return value as real JSON (records, beans,
collections — not a toString), plus its timing, stereotype and dependencies.
The whole UI has light and dark themes with a toggle.
The History tab keeps the requests you've run (and any live traffic that arrives over SSE); click one to replay its path in the graph.
How the spying works
devtools.recorder()is aBeanDecorator: beans bound as interfaces get wrapped in a JDK dynamic proxy — no bytecode generation, no agents, no reflection on your domain types beyond a small, bundled JSON serializer.- Beans bound as concrete classes can't be proxied; they pass through untouched and the dashboard marks them as not traceable. Bind by interface if you want them traced.
- A middleware opens one trace per request (reusing the request-id when the request-id middleware is on, or the dashboard's correlation header), records the matched route, request inputs and the response body, and keeps the last 100 traces.
- The devtools endpoints themselves are never traced.
Endpoints
| Endpoint | What |
|---|---|
GET /ligero/dev | the dashboard (self-contained HTML — no CDN assets) |
GET /ligero/dev/api/routes | registered routes, for the "run a request" panel |
GET /ligero/dev/api/graph | bean graph JSON (nodes, edges, unspied list) |
GET /ligero/dev/api/requests | last 100 traces, most recent first |
GET /ligero/dev/api/stream | SSE stream of completed traces |
Production
Never install devtools in production — it exposes the arguments and return values of your beans. Two switches:
- Classpath (recommended): keep the dependency out of your production
build; there is zero overhead because nothing is there. With the CLI,
--devtools falsescaffolds a project without it. - Environment:
LIGERO_DEVTOOLS=falseturnsinstall()into a no-op without a code change.